Why
When it comes to UX, it is all about qualitative and quantitative studies about users that will help to discover, understand and analyze their needs. Thanks to Google Analytics, data trends, page views, and other user actions are identified and support interpreting opportunities to guide UX/Digital professionals.
But if you are used to GA reports, you know that you can select relevant KPIs into a customized UX dashboard but when it comes to share and present your data to your boss; you don’t get the WOW effect, and your report might not even be read.
As seen in my previous post on how to measure, monitor and optimize your Digital Marketing Strategy, building a report with Google Data Studio is amazingly simple. Especially for professionals who has a hand in all kind of digital stuff and aims to show more than blue bar charts. Hope you will enjoy this Data Studio UX report and finally get your boss a “Can you share me this report?”
What
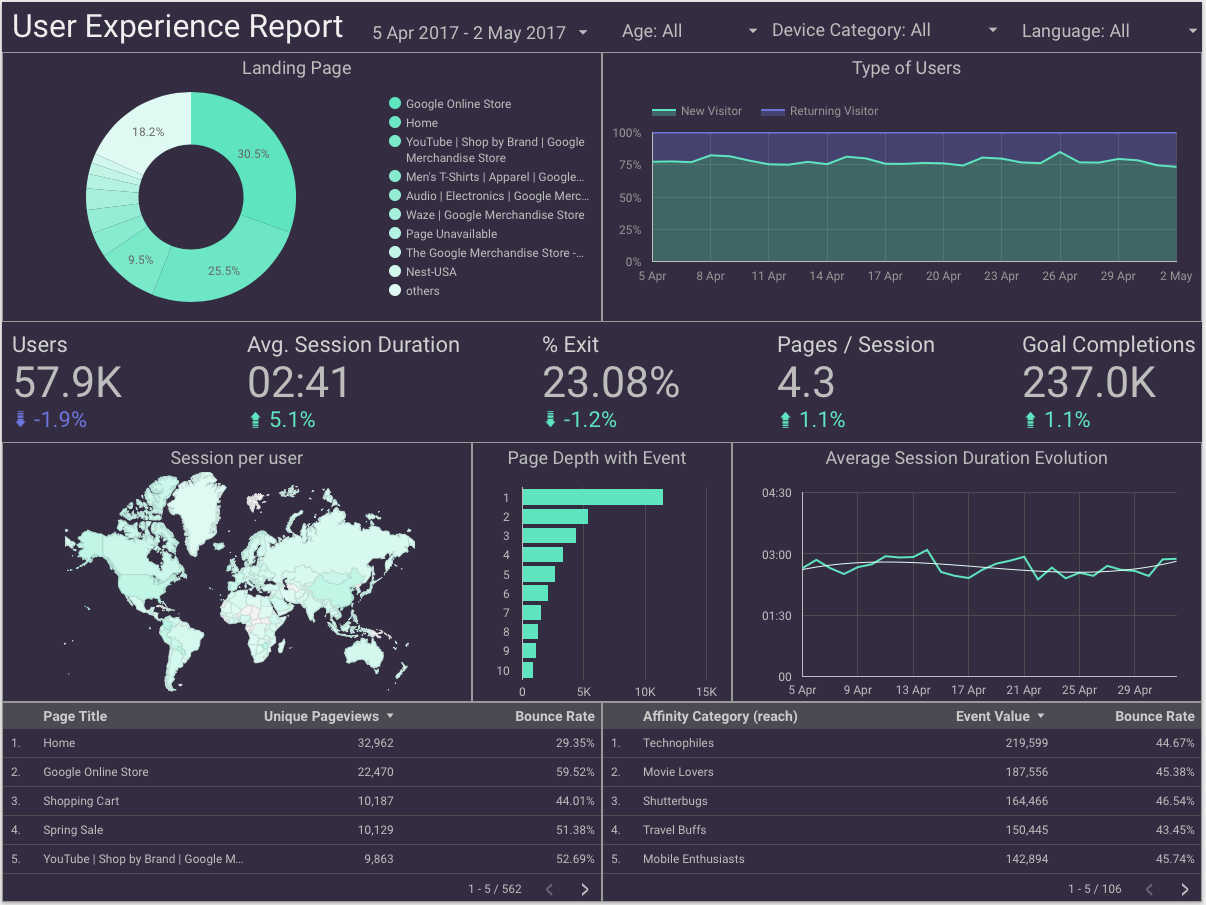

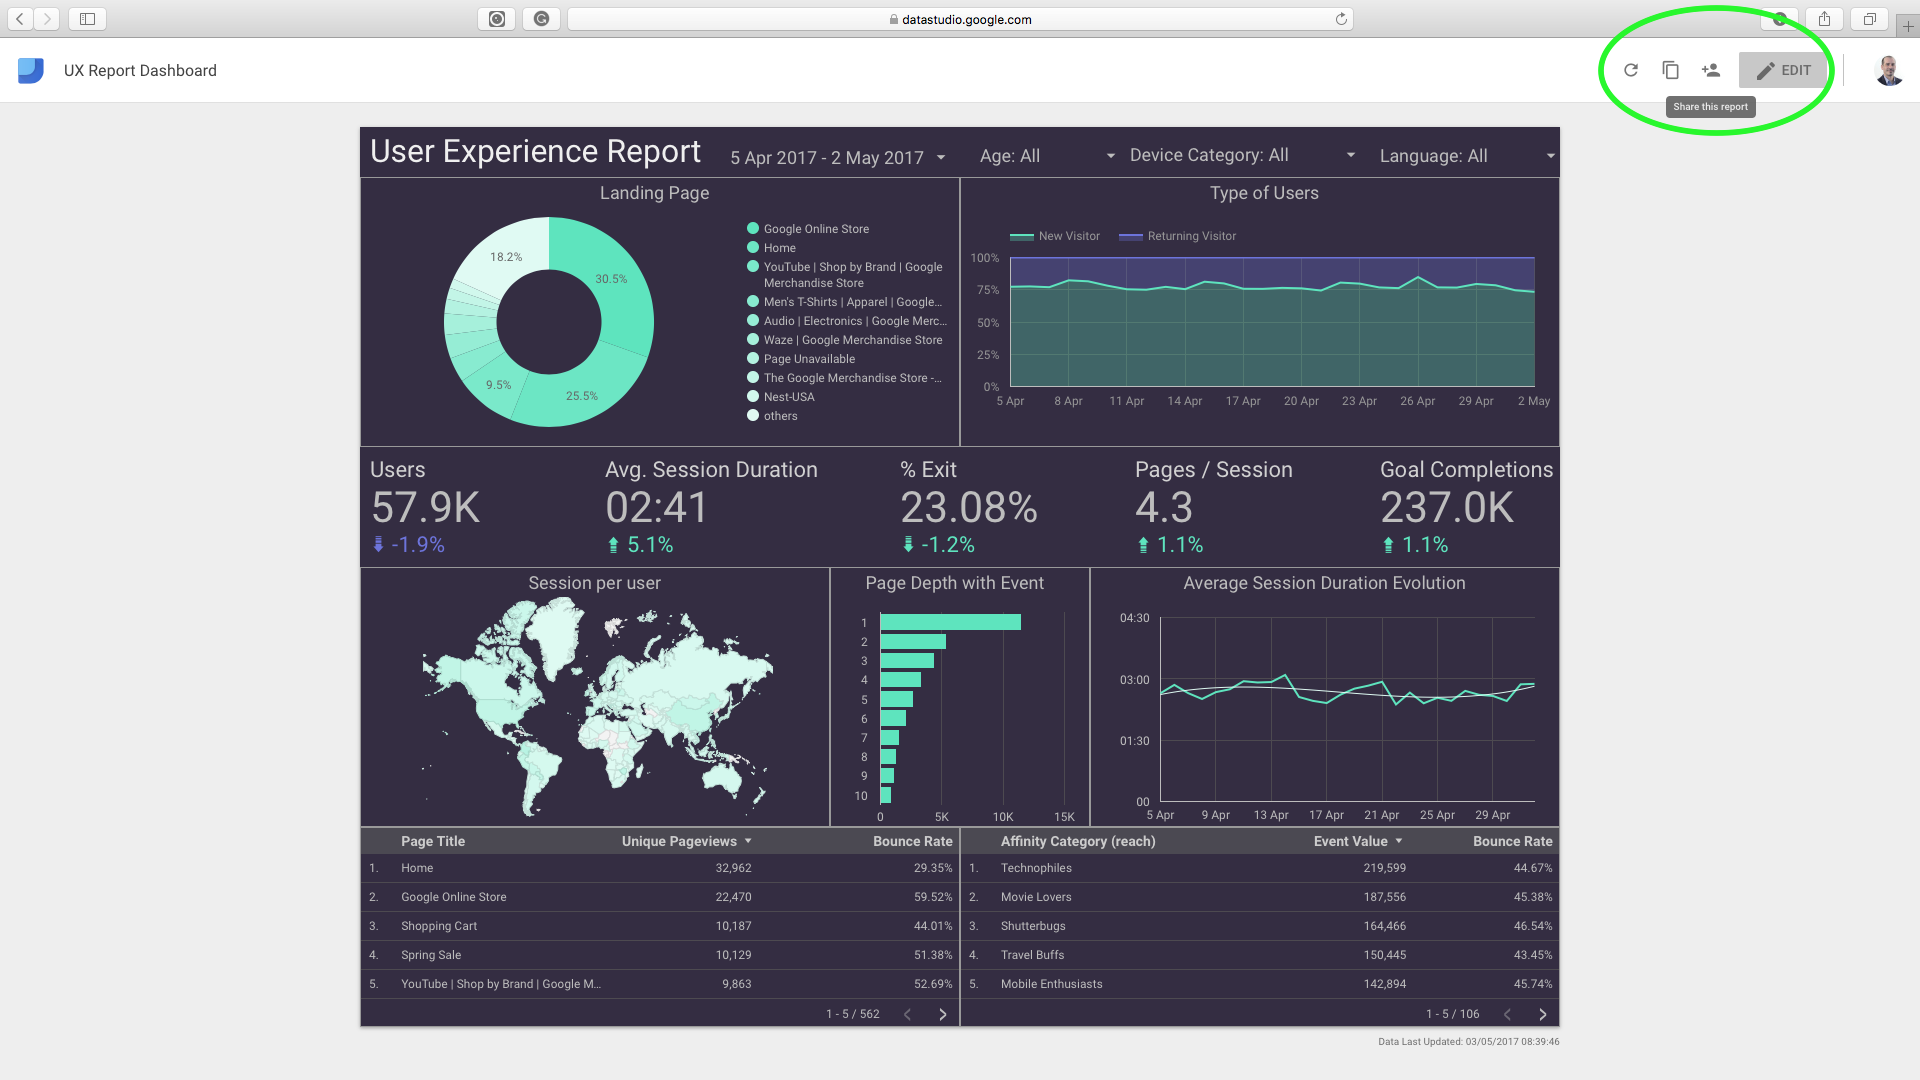
This User Experience Google Data Studio Dashboard includes the following KPIs & Features:
– Filter by Date range, Age, Device Category and Languages.
– Charts: Landing page pie chart (page title/session), User type Area Chart, GeoMap (Sessions per user), Page depth with event bar chart, Average session duration evolution chart.
– Scorecards (with date comparison with previous period): Users, Average Session Duration, % of Exit, Page per session, Goal Completions.
– Tables: Unique pageviews per Page with related Bounce Rate, Event Value per Affinity Category with related Bounce Rate
What you need to use this UX report accurately:
– Google Analytics on your website: https://www.google.com/analytics/
– Created Google Analytics Goals: https://support.google.com/analytics/answer/1032415?hl=en
– Created Google Analytics Events: https://support.google.com/analytics/answer/1136960?hl=en
– Signed in with your account on Google Data Studio: https://www.google.com/analytics/data-studio/
– To go further, you can also report your A/B tests: https://fxcuissot.com/how-to-run-ab-test-google-optimize/
How
- Follow this Google Data Studio link
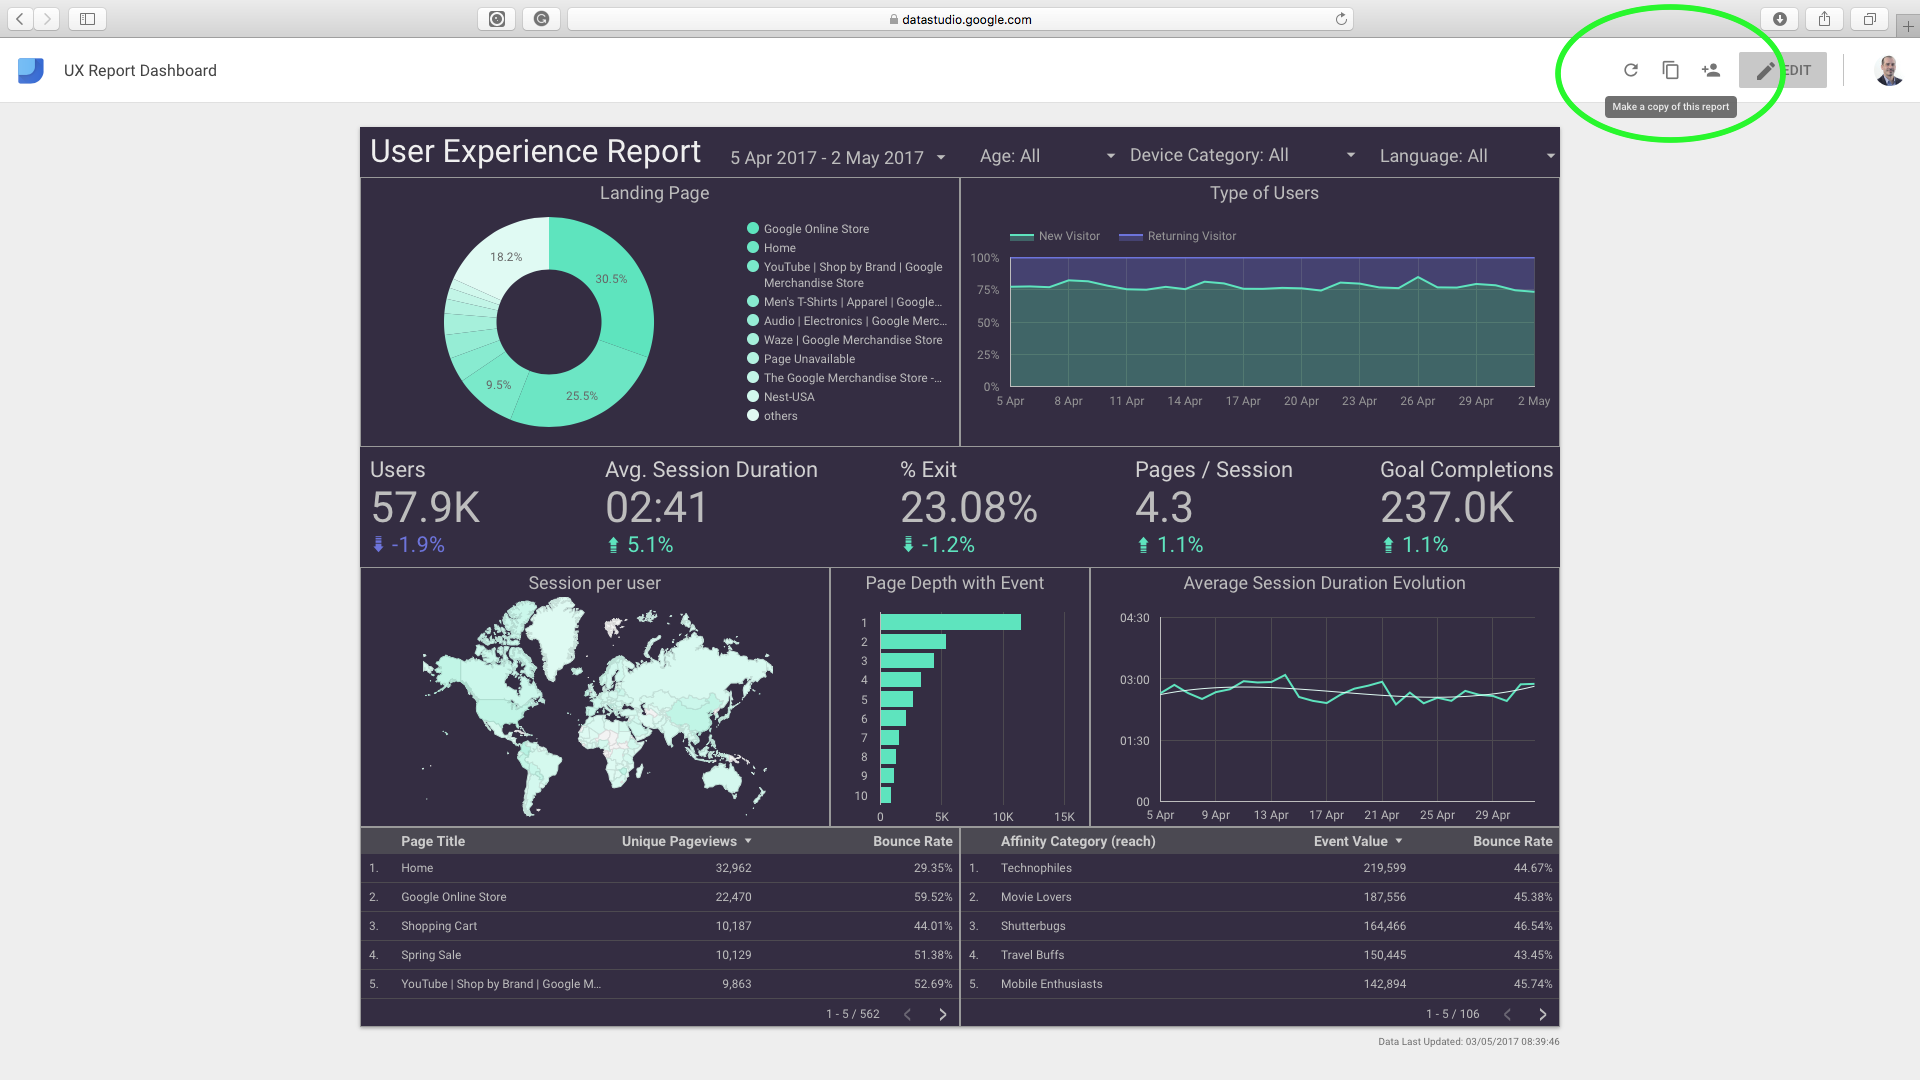
- Select File > Make a copy
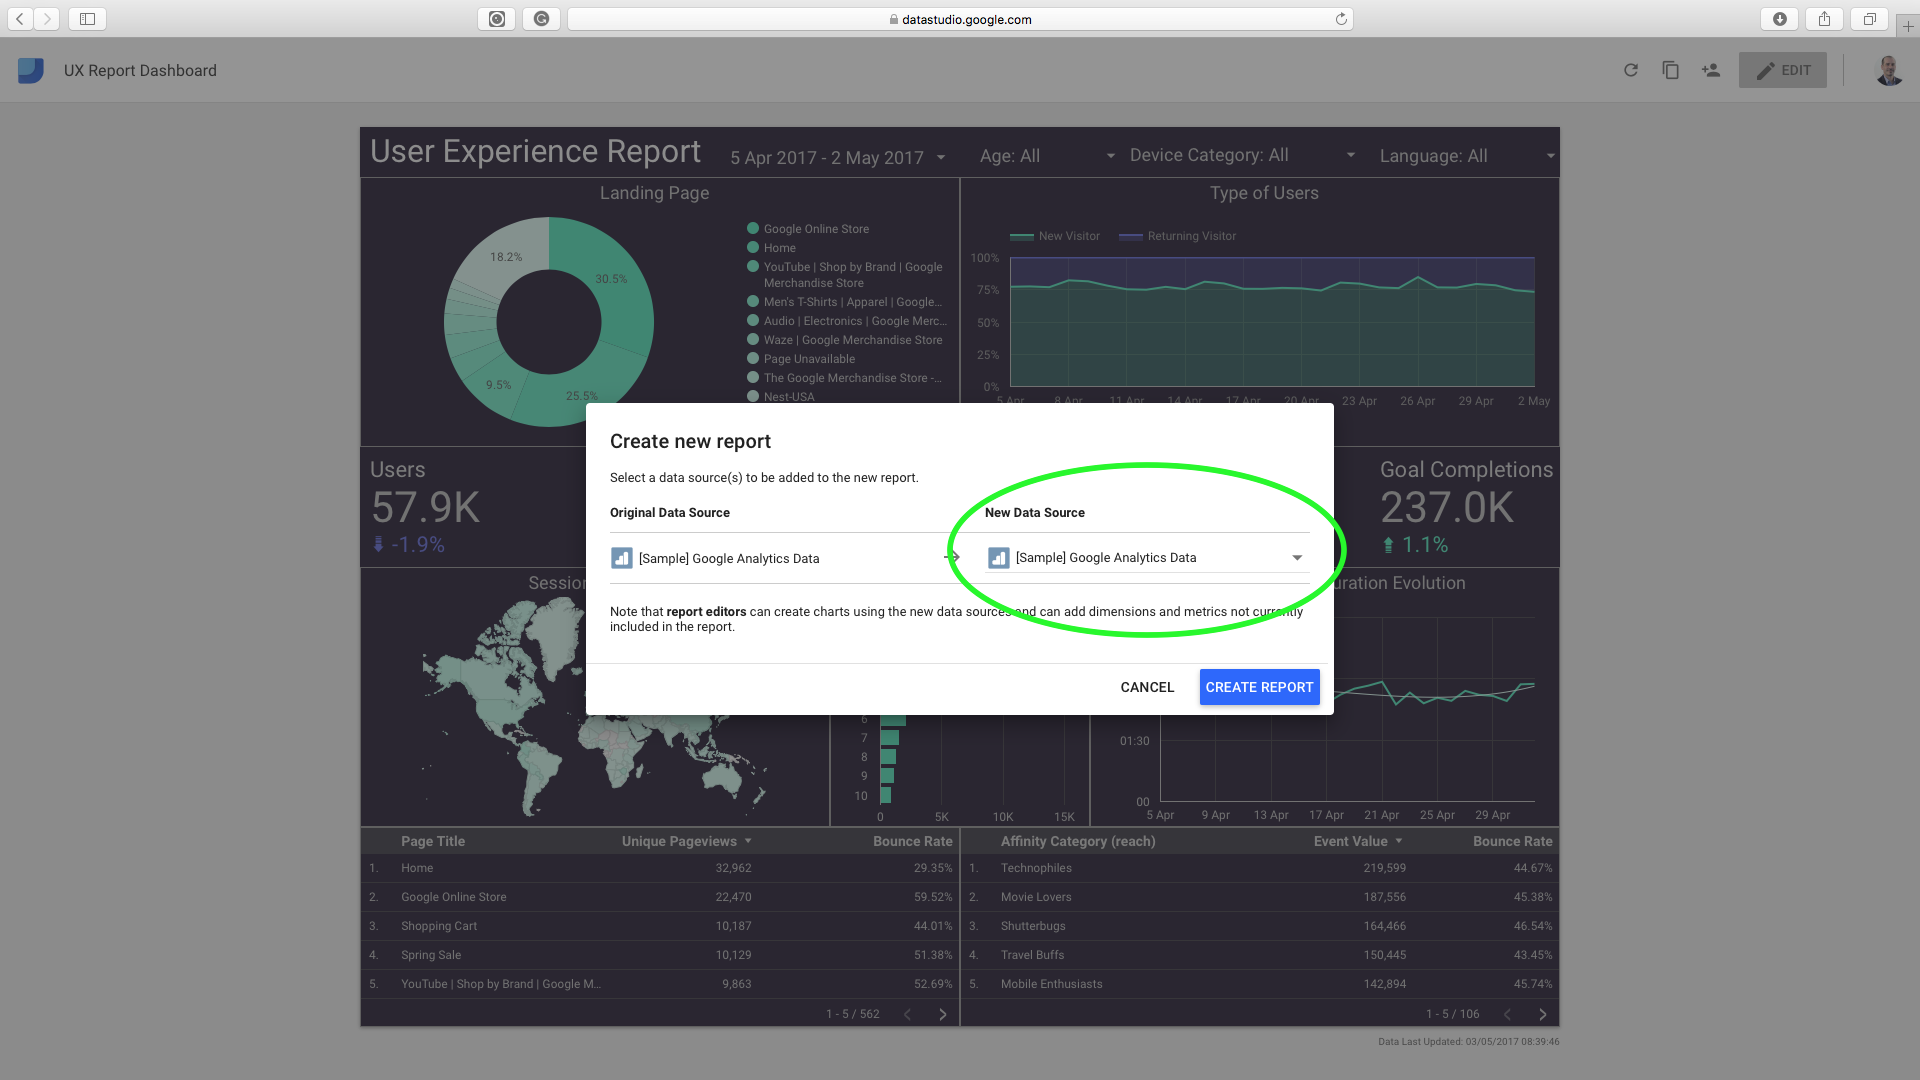
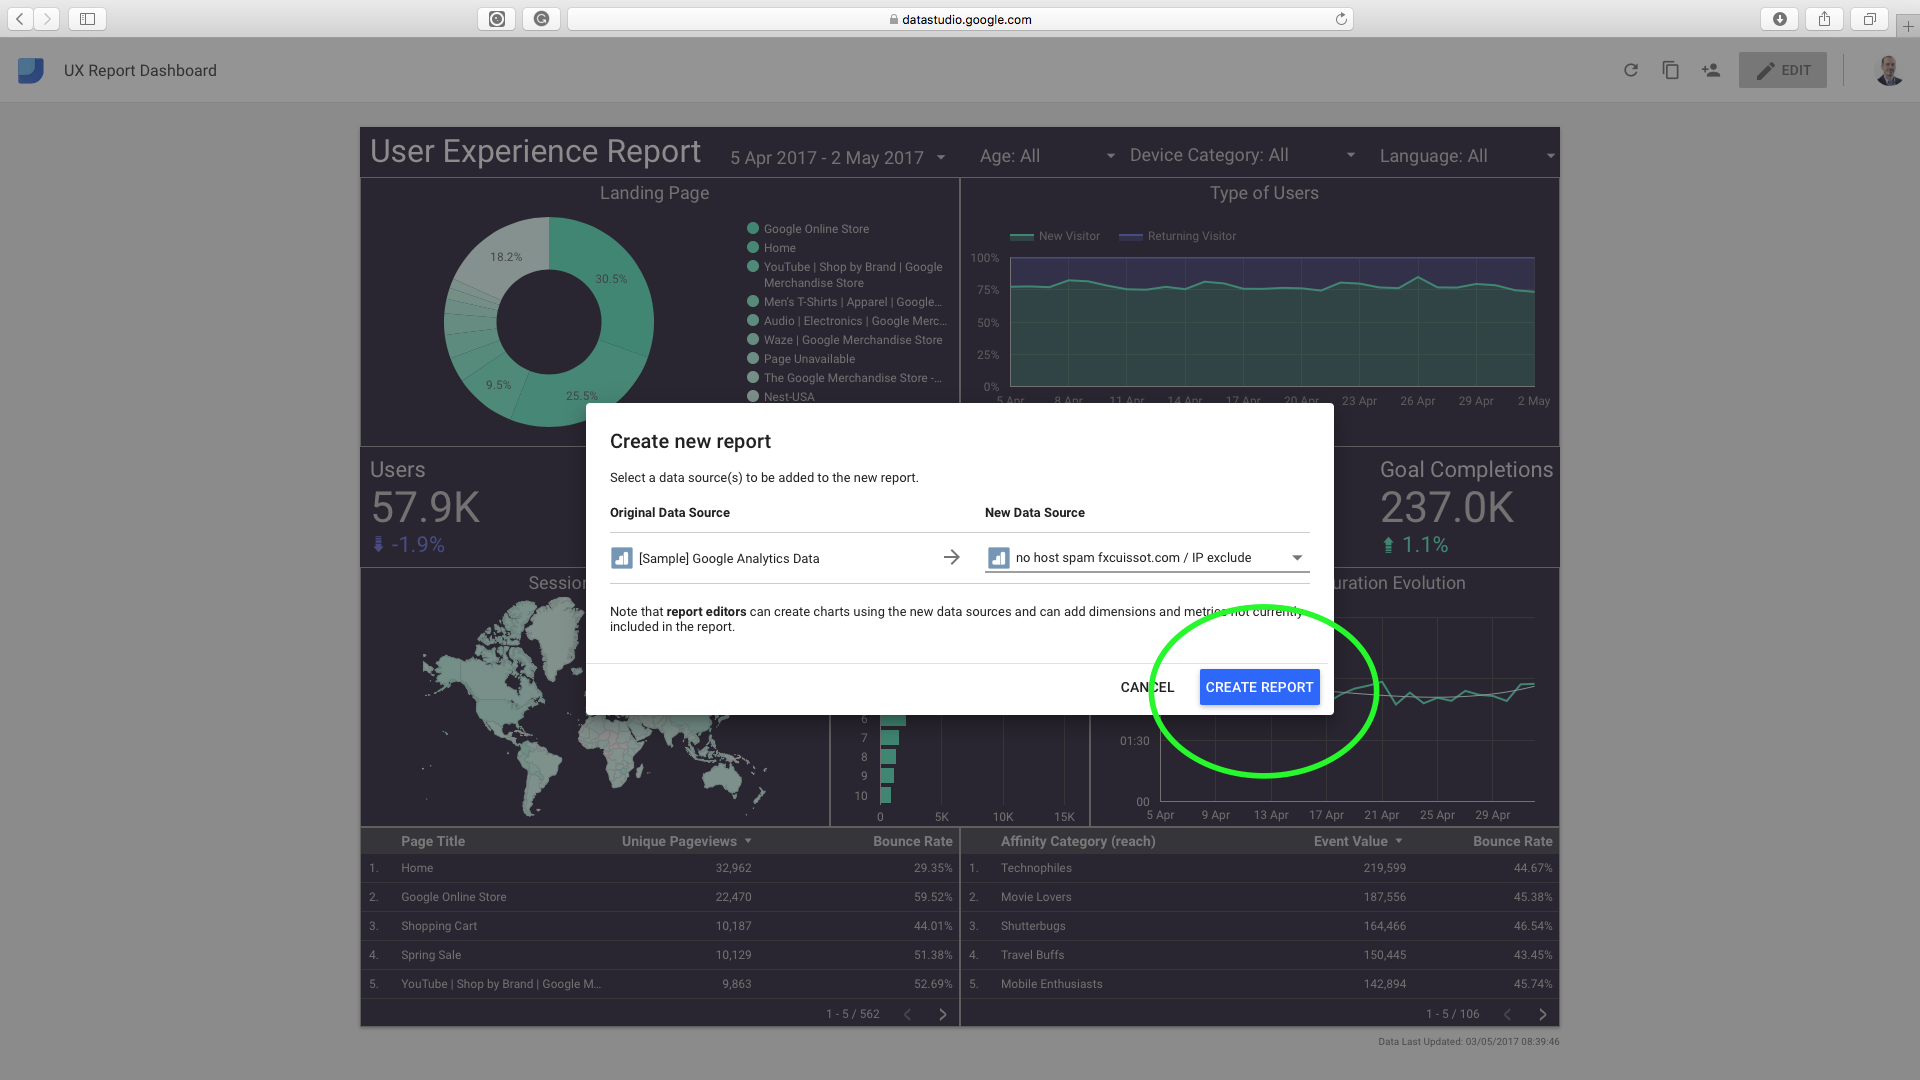
- Create new report > Select New Data Source from your GA account > Create report
- Enjoy

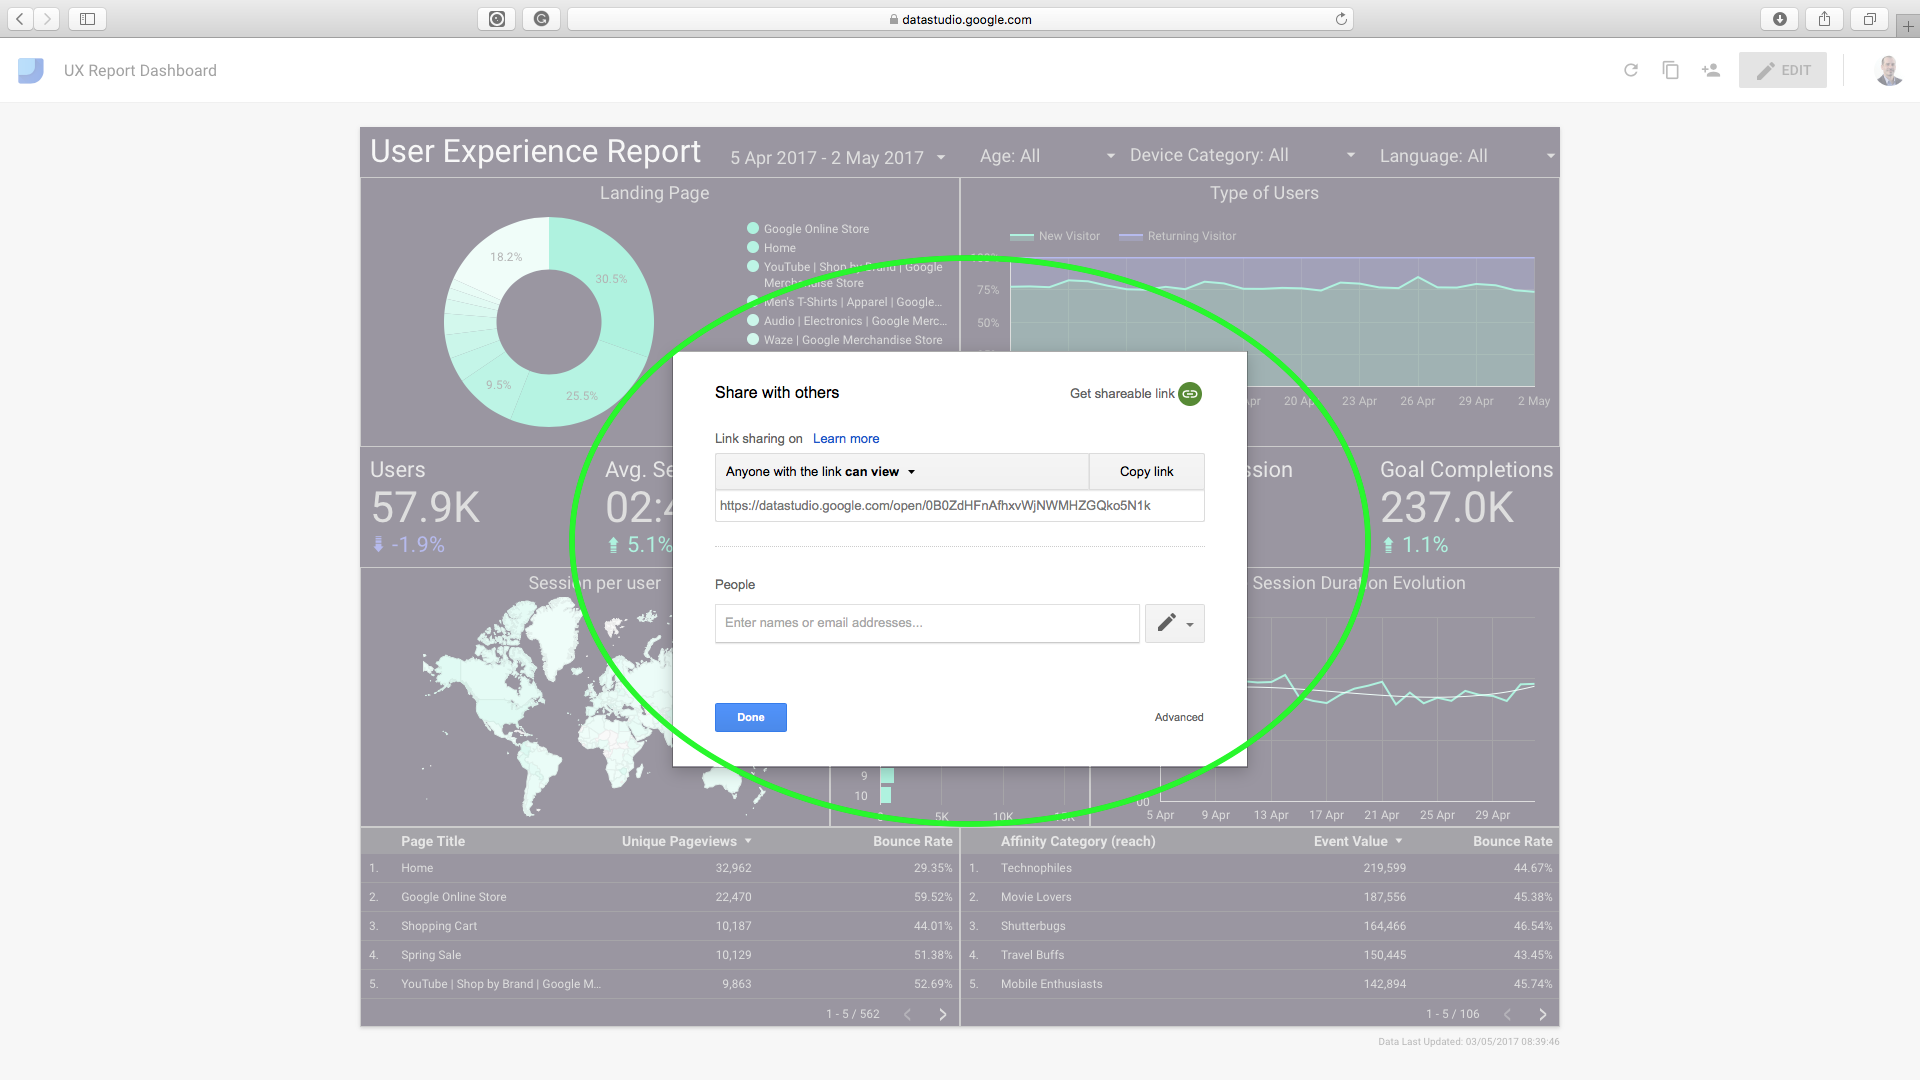
- Share with your colleagues & stakeholders