Why
Google Analytics is an insanely powerful tool but when it comes to data presentation in a meeting with stakeholders or on a live screen in your open space, your GA dashboards are not enough.
Data Visualisation is a growing important part of your Marketing Technology Stack for communicating & optimizing data, like the R.A.C.E. framework helps with a weekly or monthly review measuring the current effectiveness of your digital marketing with relevant KPIs for measuring Reach, Actions, Conversion, and Engagement; why not getting the best of both worlds?
Thanks to Google Data Studio‘s recent announcement about “link sharing with anyone”, I can now share with you the R.A.C.E dashboard I have built for this website. Here is what and how to get it.
What
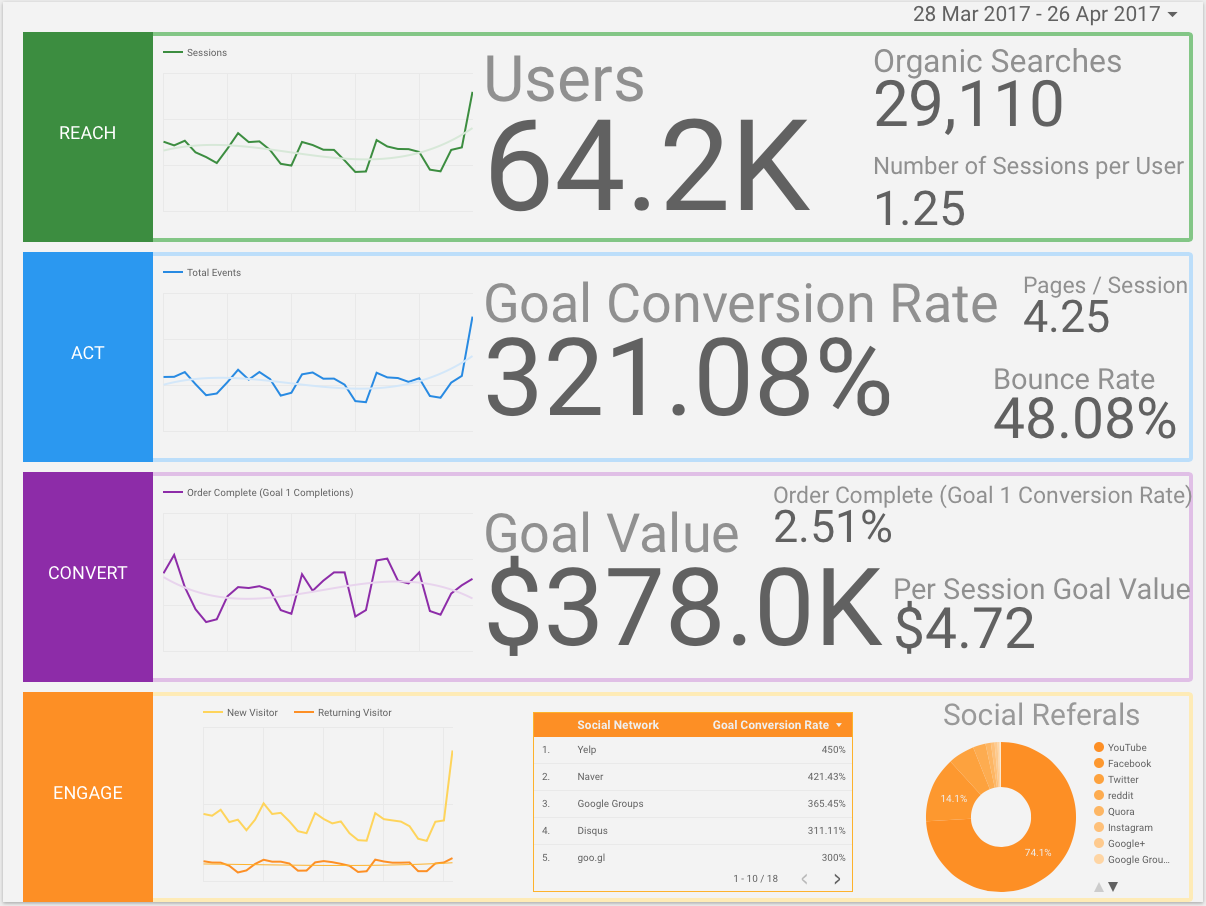
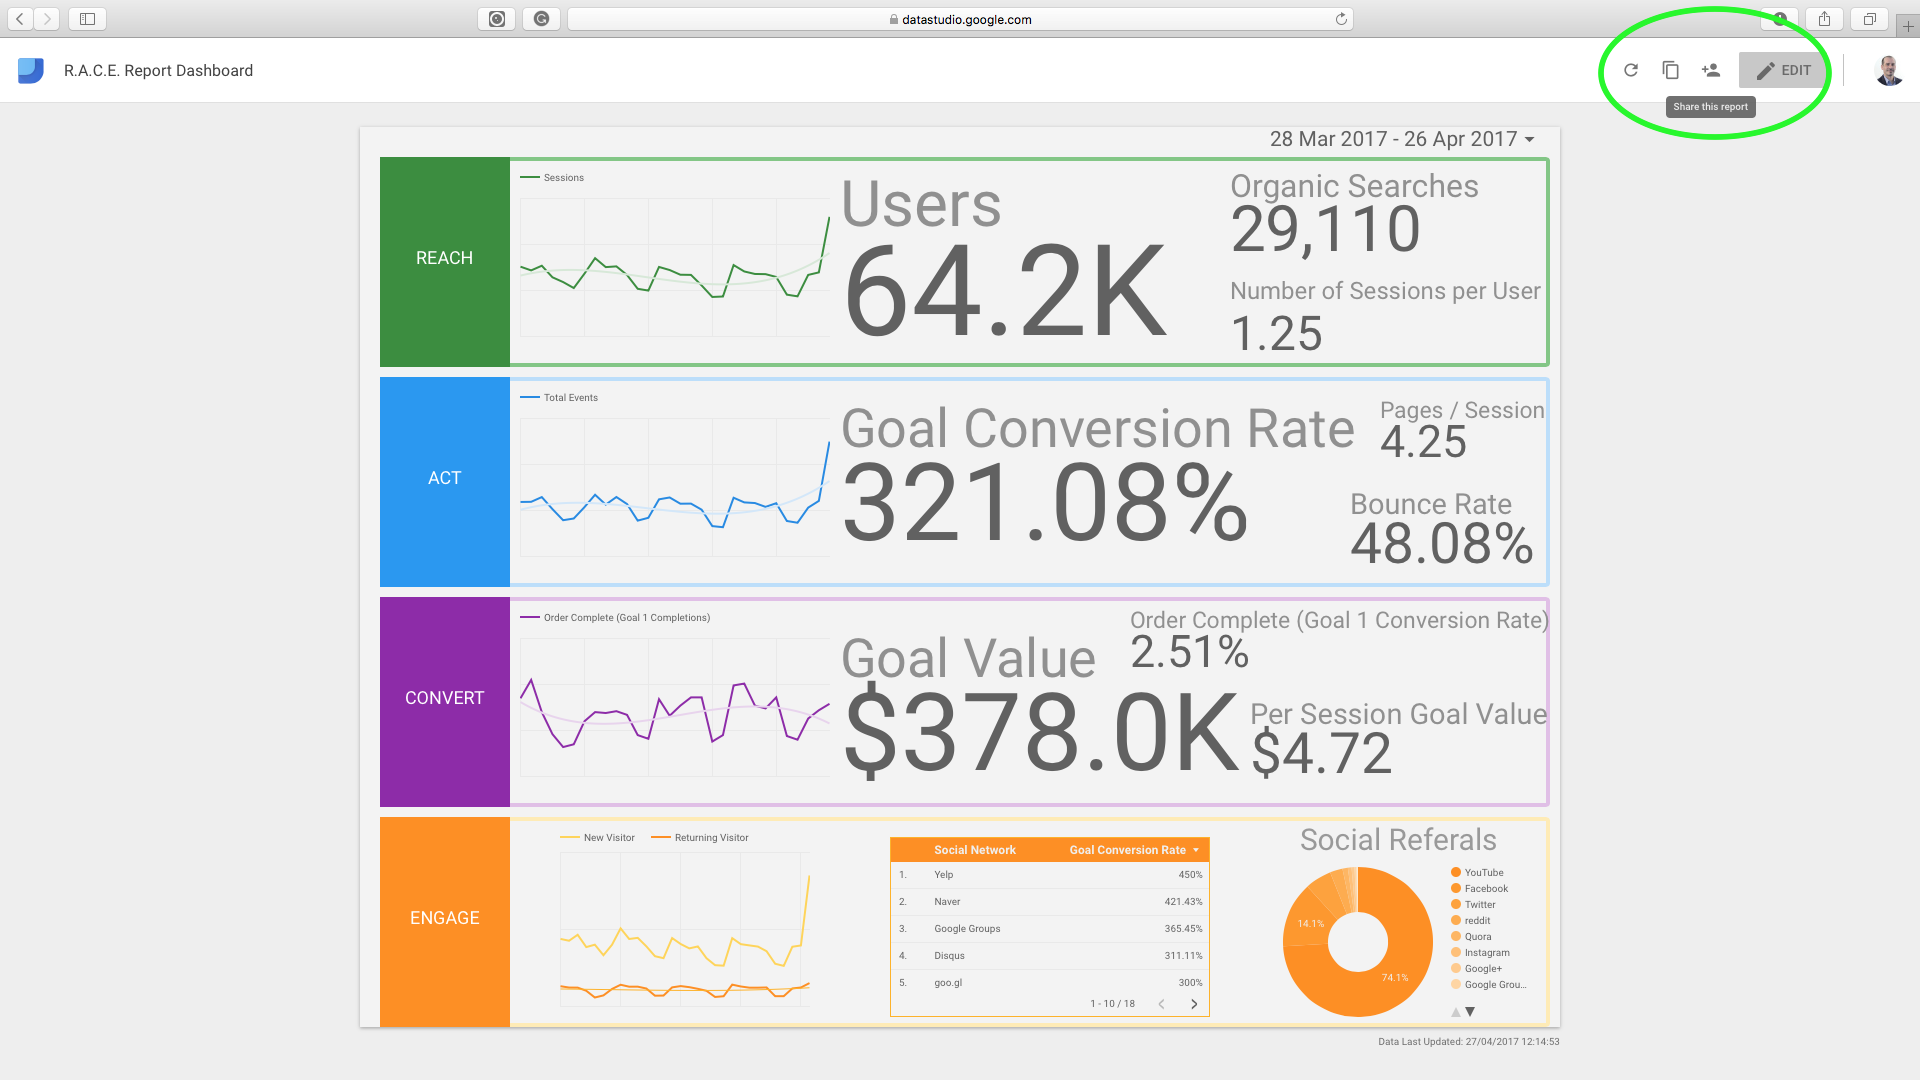
This R.A.C.E. Google Data Studio Dashboard includes the following KPIs:
– Reach: Sessions chart, Users, Organic searches, Number of sessions per users.
– Act: Total events chart, Goal conversion rate, Page per session, Bounce Rate.
– Convert: Orders completed chart, Orders value, Order conversion rate, Value per session.
– Engage: User type chart, Social networks conversion rate, Social referers.
What you need in order to use this Google Data report properly:
– Google Analytics on your website: https://www.google.com/analytics/
– Created Google Analytics Goals: https://support.google.com/analytics/answer/1032415?hl=en
– Created Google Analytics Events: https://support.google.com/analytics/answer/1136960?hl=en
– Signed in with your account on Google Data Studio: https://www.google.com/analytics/data-studio/
How
- Follow this Google Data Studio link
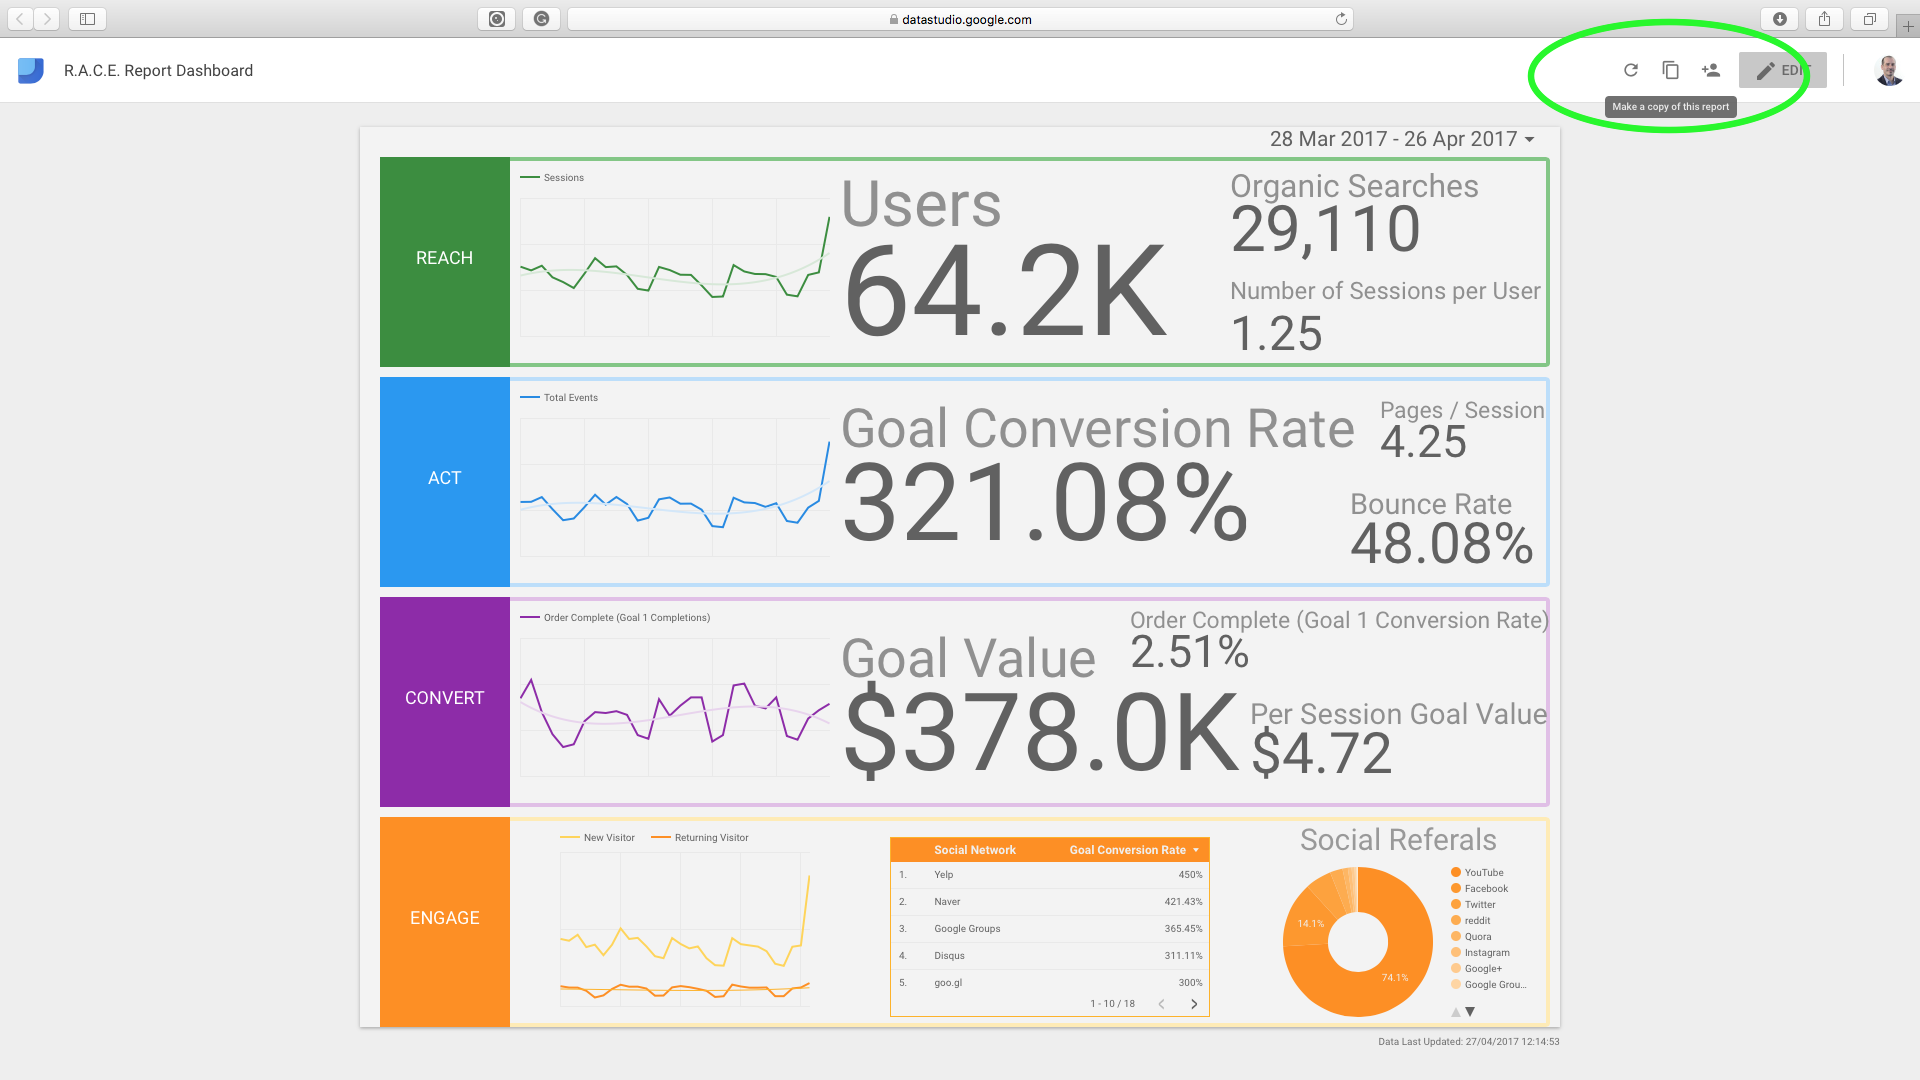
- Select File > Make a copy
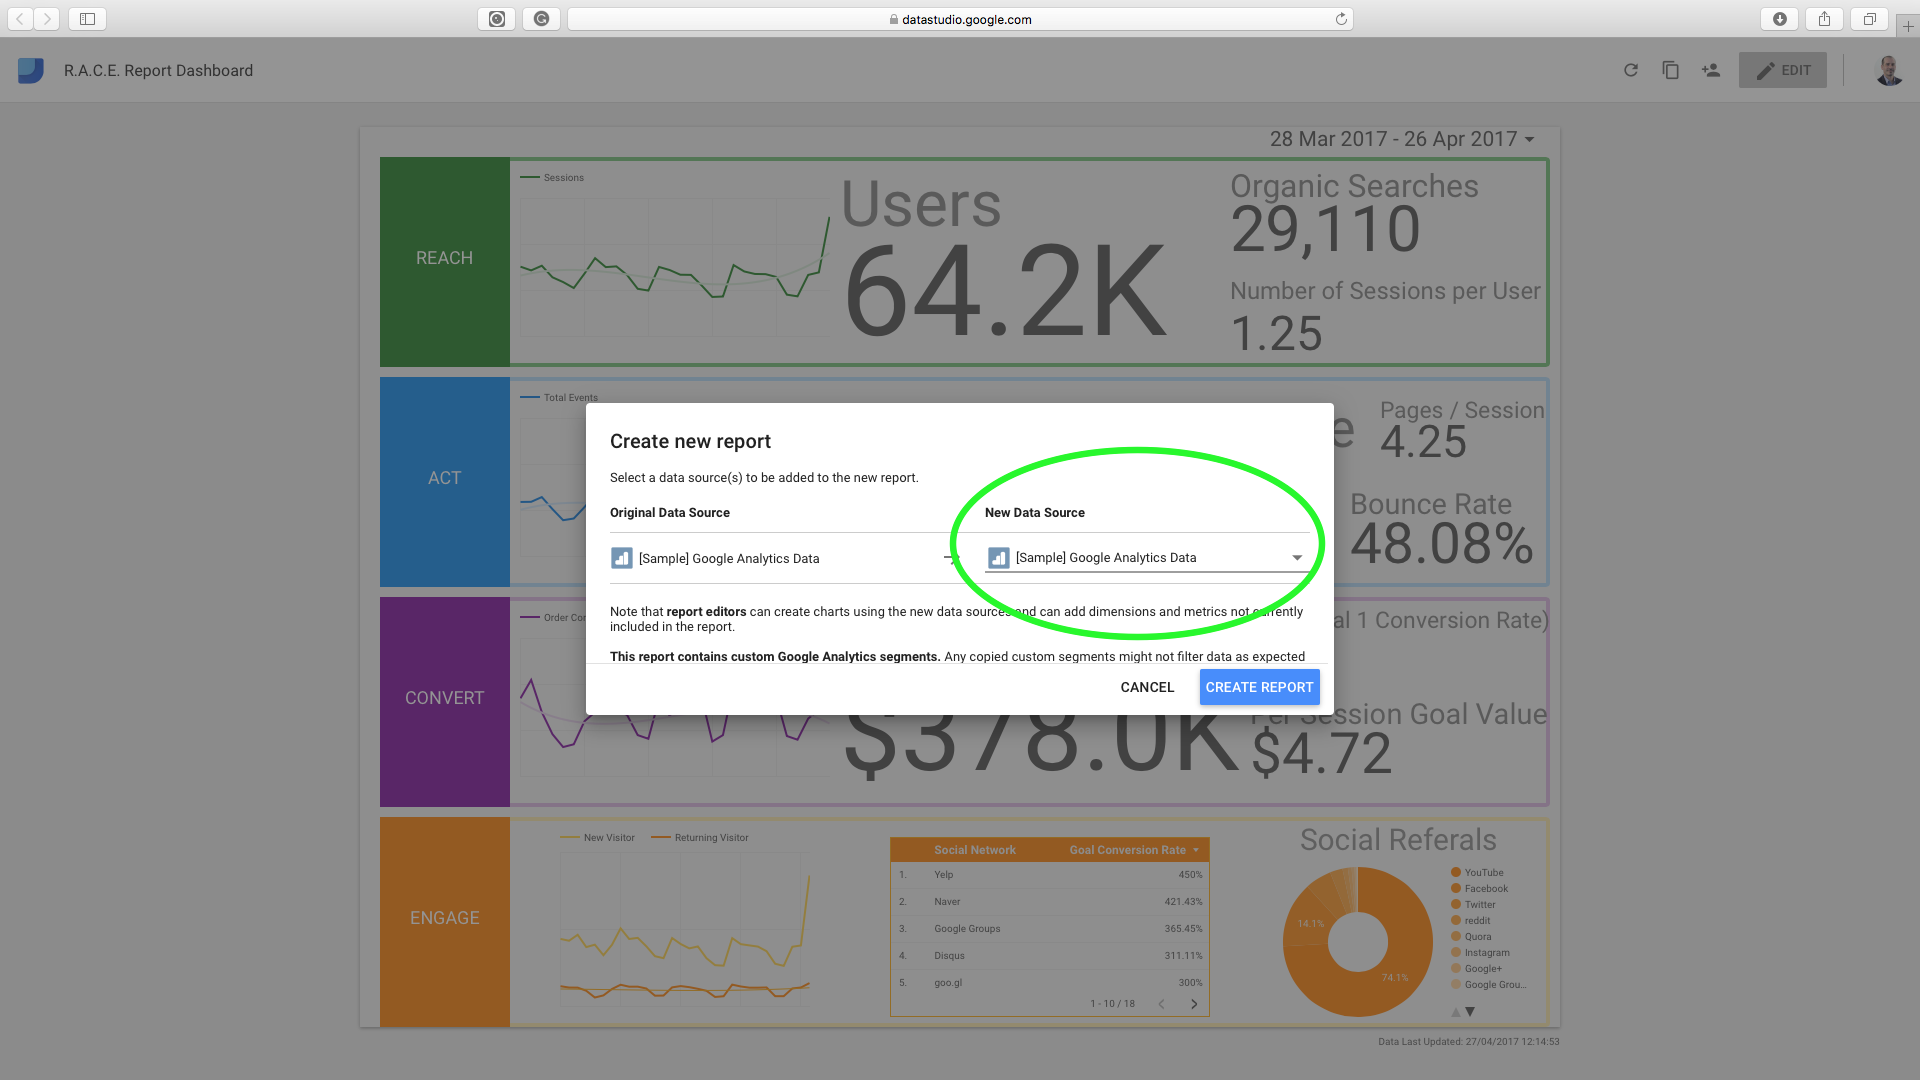
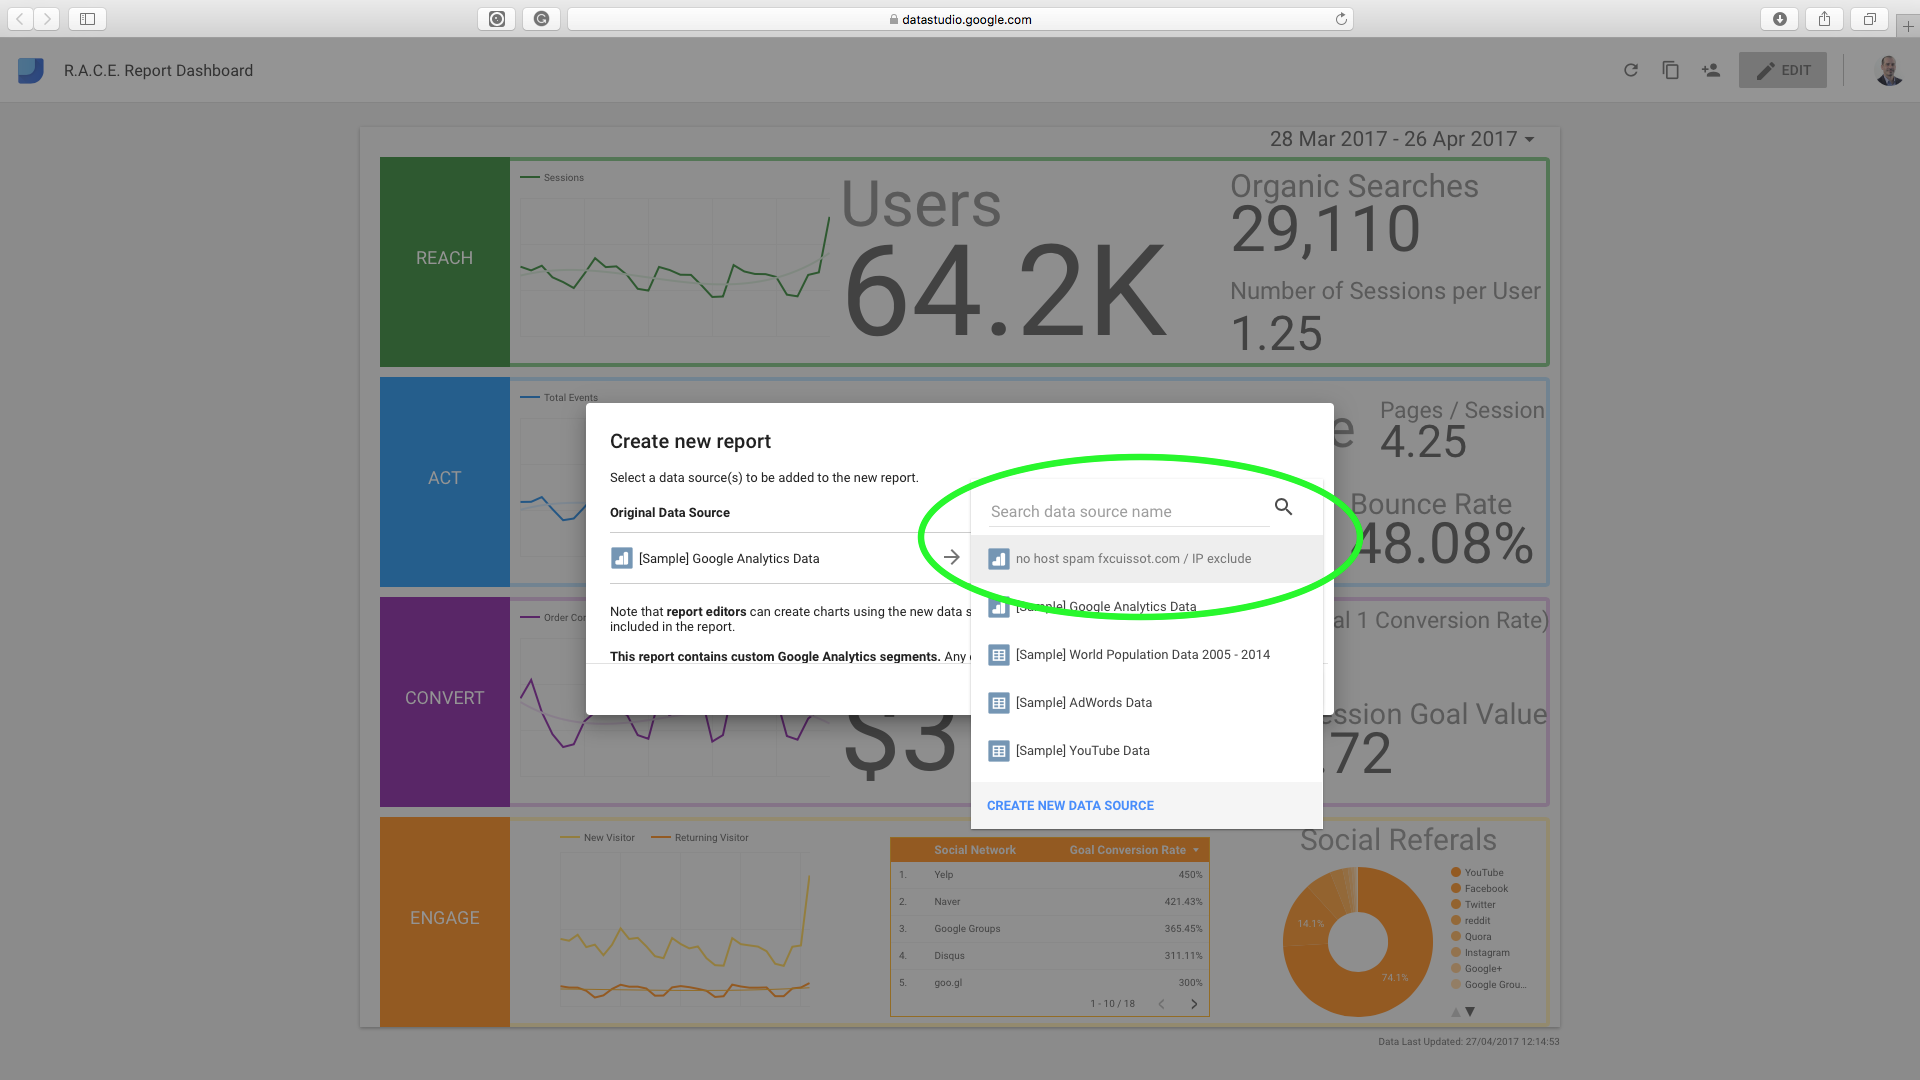
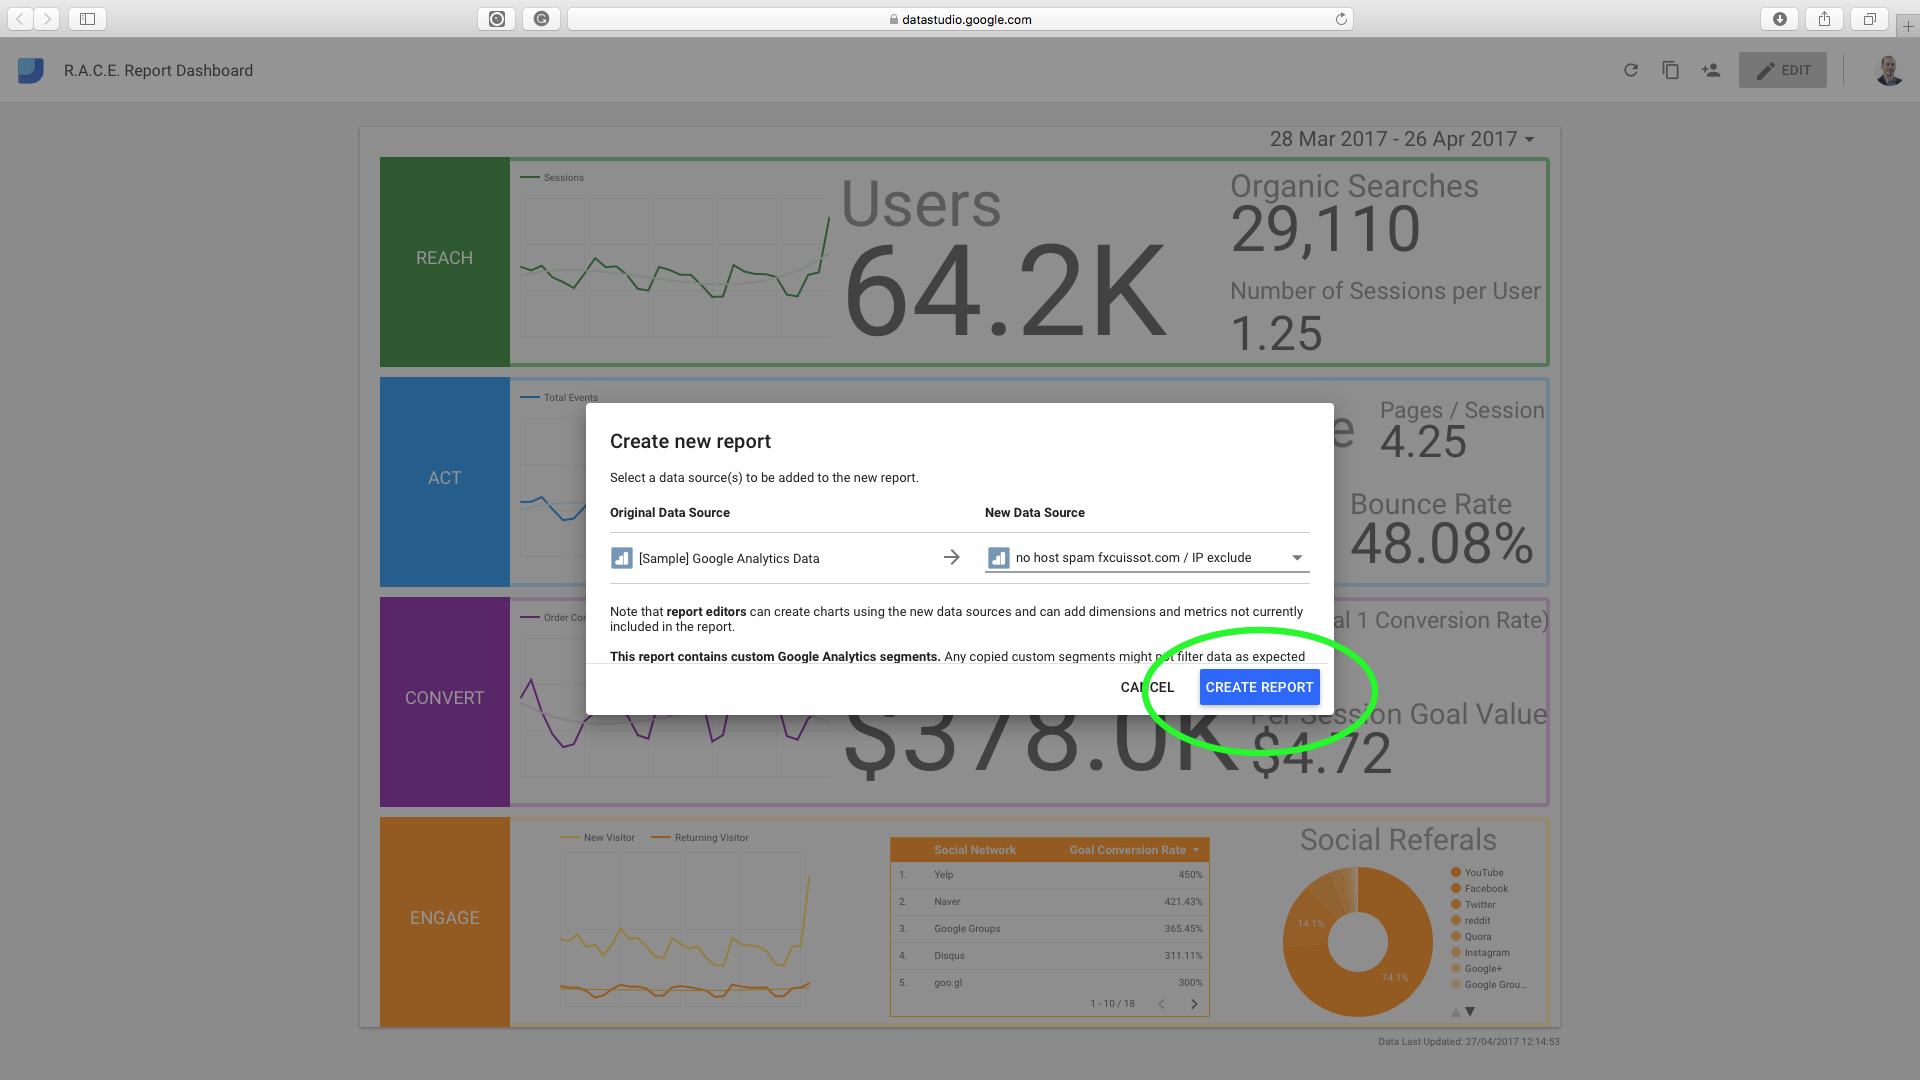
- Create new report > Select New Data Source from your GA account > Create report
- Enjoy 🙂
- Share with your colleagues & stakeholders
Check out Google Data Studio RACE report
